Creating or Adding a Flow Chart to Your Google Document
Hey there! Today, I want to show you how you can easily create or add a flow chart to your Google Doc. It may seem a little confusing at first, but I promise it’s not as complicated as it sounds. Let’s dive right in!
To start off, you’ll need to open your Google Doc. Once you have it open, go ahead and find the “Insert” tab at the top of the screen. You might have to look around a bit, but trust me, it’s there.
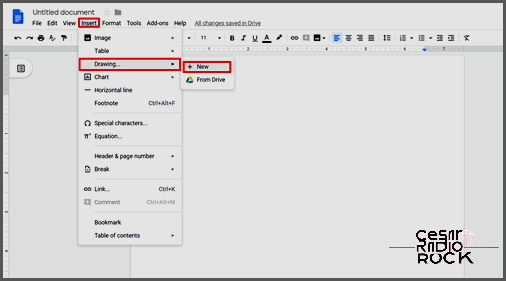
Clicking on the “Insert” tab will give you a dropdown menu. You’ll want to scroll down until you see the option for “Drawing.” Go ahead and click on that. A new window will pop up, and this is where the magic happens.
In the drawing window, you’ll have a range of tools available to create your flow chart. It might take some time to get the hang of them, but don’t worry, you’ll be a pro in no time. Take a look at all the options and feel free to explore them.
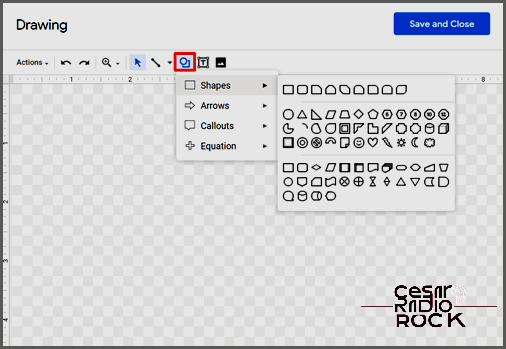
To add shapes to your flow chart, click on the “Shape” icon in the toolbar. You’ll see a variety of shapes to choose from, such as rectangles, circles, and arrows. Pick the shape that suits your needs and click on it.
Once you’ve selected a shape, simply click and drag your mouse on the canvas to create it. You can resize the shape by clicking and dragging the blue dots on the edges. You can also change the color and style of the shape by using the options in the toolbar.
To connect the shapes in your flow chart, you’ll want to use the “Line” tool. Click on the “Line” icon in the toolbar and then click on the edge of one shape. Hold down your mouse button and drag the line to the edge of another shape. Release the mouse button, and voila! You’ve connected two shapes.
Repeat this process to connect all the shapes in your flow chart. You can add text to the shapes by selecting a shape and clicking on the “Text” icon in the toolbar. This will allow you to explain each step or decision in your flow chart.
Once you’re happy with your flow chart, you can insert it into your Google Doc. Simply click on the “Save and Close” button in the drawing window, and your flow chart will be added to your document.
Remember, practice makes perfect! Don’t be discouraged if your first flow chart doesn’t turn out exactly as you envisioned. Experiment with different shapes, colors, and styles to find what works best for you.
I hope this guide has been helpful in showing you how to create or add a flow chart to your Google Doc. Now you can easily illustrate your ideas, processes, or decision-making steps. Happy charting!

Hey there! Have you heard about Google Docs? It’s a cool online tool that’s a great alternative to Microsoft Office. You can do all the same things you’d do in Word, Excel, and other Office tools, but the best part is that your docs are saved in your Google Drive. That means you can access them from any device, anytime you want. Pretty convenient, right? Today, let’s dive into how you can use Google Docs to create awesome flow charts for your presentations.
Creating Flow Charts in Google Docs
So, there are a couple of methods you can use to create flow charts in Google Docs. Let’s start with the manual method. It’s pretty straightforward, but it does require you to create each bubble manually. It’s a good option if you don’t create flow charts too often and prefer doing things yourself. Now, if you create flow charts on a regular basis, there’s a paid add-on called Lucidchart that can do the job for you automatically. It’s a lifesaver for those who have to churn out flow charts daily because it takes care of most of the work. Don’t worry, I’ll walk you through both methods.
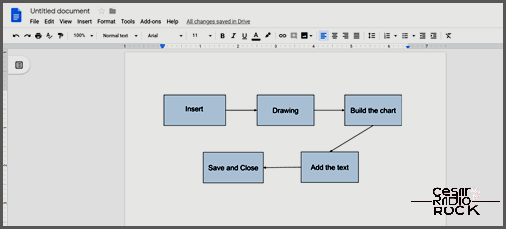
Method 1 – Make the Charts Manually
Did you know that Google Docs has a cool feature called Google Drawings? It’s a native app that lets you create all sorts of shapes and objects, making it perfect for making flow charts. Here’s what you need to do:
- First, open up Google Docs and create a new blank file.
- Next, click on the “Insert” tab and hover your mouse over “Drawing.” Then, select “+New.”
- A new window will appear. Click on the “shape” icon and choose an object to add to your flow chart.
- Repeat this process for each object you want in your flow chart. You can copy and paste shapes to make sure they’re all the same size.
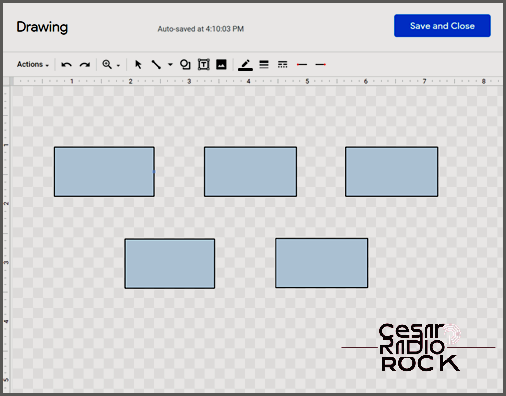
- Once you’ve inserted and placed all your objects, connect them with lines, curves, or arrows.
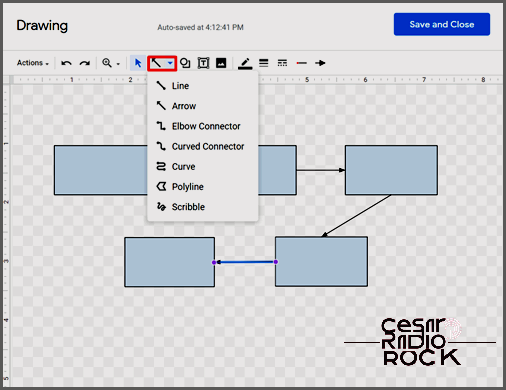
- If needed, add text to your flow chart. You can also use the available tools to customize it even more.

- Click “Save and Close” to see your chart in your Google document.
- You can edit the flow chart anytime by double-clicking on it.
As you can see, creating a flow chart in Google Docs is pretty straightforward. However, things can get more complex if you need to make a large and intricate flow chart with lots of elements.
The Drawbacks of Creating Flow Charts in Google Drawings
While Google Drawings can be a bit time-consuming, there are a few other downsides:
- You have to edit each shape one by one.
- Getting the arrows to look just right can be tricky and may make your flow chart seem unpolished.
- It takes at least three clicks to draw lines, which can often turn out uneven.
- If you don’t like the shapes in the library, using shapes from other sources can be a hassle.
- You can’t save flow charts as standalone documents. You can copy them to other docs, but you can’t save them to Sheets or slides.
Now, let’s check out an add-on that can solve these issues.
Method 2 – Create Flow Charts Using Lucidchart
If you find yourself spending a lot of time making flow charts in Google Docs, it might be worth investing in Lucidchart. It’s a handy add-on that can help you work much faster. With formatting commands at your fingertips, your charts will also look more professional, with all the elements perfectly aligned. Here are some of the benefits of using this add-on:

- When using Google Docs, you have the ability to draw shapes and connect them with lines without constantly switching to the toolbox. This handy feature saves you time and makes the process more efficient.
- The best part is that the diagrams you create are saved as individual documents, which means you can reuse them in the future. This saves you a great deal of time and effort, as you won’t have to start from scratch every time you need a flow chart.
- Another advantage of using Google Docs is that it offers a wide variety of shapes and charts that are not available in other programs like Google Docs. This gives you more options for designing your flow charts and making them visually appealing.
- Moreover, Google Docs provides additional options and features that can help you create unique and customized charts. This allows you to express your creativity and make your charts truly stand out.
However, it is important to mention that the only significant downside of using Google Docs for creating flow charts is the price. Some features and add-ons may require a payment, so it’s worth considering your budget before committing.
Create Impressive Flow Charts with Google Docs
Whether you choose the first or second method, Google Docs offers powerful tools that can help you create professional-looking flow charts for various purposes. The first method is suitable if you don’t need to create flow charts frequently, but it can be time-consuming, especially for large charts. On the other hand, the second method, using the Lucidchart add-on, enables you to work faster and achieve better results. However, keep in mind that there is a cost associated with using the add-on, so you should weigh the benefits against the investment.
Now that you know how to use Google Docs to create flow charts, I invite you to share your experience. Have you ever used Lucidchart or do you prefer the manual method? Feel free to share your insights and expertise in the comment section below.
